
msRepeatFinder – Polymer Analysis Software with KMD
Kendrick Mass Defect (KMD) analysis is a method proposed by Edward Kendrick in 1963 [1] that is still used today in the petrochemical field. In mass spectrometry, an accurate mass obtained by a high resolution mass spectrometer uses a unit system with its mass of 12C being 12.0000 u, while Kendrick mass (KM) uses a unit system of CH2 = 14.00000. It is possible to classify the mass spectrum peaks of an extremely complex mixture mainly consisting of hydrocarbons, such as crude oil, according to the degree of unsaturation of the hydrocarbons and the presence or absence of heteroatoms
The National Institute of Advanced Industrial Science and Technology (AIST) and JEOL Ltd. have succeeded in applying the principle of the Kendrick mass defect method to the analysis of high resolution mass spectra of polymers [2]. In this case, KM is defined so that the exact mass of the monomer, which is a repeating unit, is an integer. Creating a Kendrick Mass Defect (KMD) plot allows you to visualize the types and numbers of polymers in complex mass spectra without assigning individual mass spectrum peaks. Recently, the Fraction Base KMD method, Remainder of KM method, etc. have been proposed as related technologies that can be applied to the analysis of polymers over a wide mass range, and to the structural analysis of polymers by MS/MS. These KMD technologies not only shorten the time required for polymer analysis, but also facilitate information sharing.
[1] E. Kendrick, Anal. Chem. (1963) 35, 2146–2154.
[2] H. Sato et. al, J. Am. Soc. Mass Spectrom. (2014) 25, 1346-1355
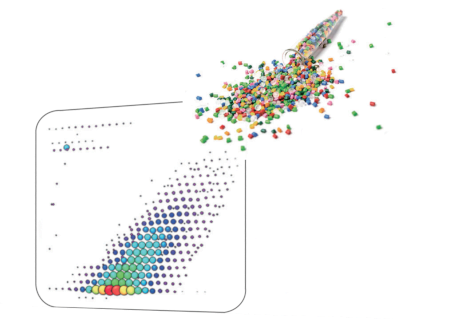
How Polymers Appear on KMD Plot
Understanding how polymers look on KMD and KMR (Kendrick Mass Remainder) plots will facilitate analysis. The horizontal axis of the KMD plot is the integer part of KM, or nominal KM, and the vertical axis is the KMD, which is the difference between the nominal KM and the KM. In KMD analysis, one monomer needs to be set first. The mass spectral peaks of the polymer composed of that monomer are aligned parallel to the horizontal axis on the KMD plot. Since the KMD value depends on the end group, in the case of a mixed sample of homopolymers with different end groups, multiple series arranged horizontally along the horizontal axis may be observed. KMR plots can be used for mixtures of homologous polymers with different end groups. The horizontal axis is the remainder of the nominal KM divided by the nominal mass of the monomer. Polymers with the same end group are aggregated at one point, and homopolymers with different end groups, which are difficult to distinguish on the KMD plot, can be easily identified.
KMD Plot
A series consisting of the specified monomers is lined up parallel to the horizontal axis. Visualization of polymer type / molecular weight distribution.

KMR Plot
A series that consists from the same monomer and end groups is aggregated into a single point. Series that are difficult to separate with a KMD plot can be identified. Since the molecular weight distribution cannot be visualized, it is used in combination with a KMD plot.

Polymers composed of monomers different from the specified monomer can be easily identified because they are arranged in diagonal straight lines on the KMD plot. For a copolymer, for example, in the case of a binary system, two types of monomers compose the constituting units. If one of them is specified, the distribution will be parallel to the horizontal axis, and the distribution of the other monomer will be diagonally arranged. Since each monomer has a distribution, it is visualized in the KMD plot as a grid of parallelograms.
For a mixture of different polymer species
When a certain monomer is specified, the polymers consisting of that monomer are lined up parallel to the horizontal axis, and the other polymers are lined up diagonally.

For binary copolymers
Since each of the two monomers has a distribution, a grid pattern is formed.

End-group analysis of polymers by using a high mass-resolution MALDI-TOFMS
By applying the msRepeatFinder to the mass spectrum measured by the ultra-high mass-resolution MALDI-TOFMS, JMS-S3000 SpiralTOF™ series, mixtures of homopolymers with different end groups can be separated and grouped. It is also possible to search and group the points on the KMD plot by specifying the composition of the end groups. Relative ionic intensities and polymer index values are calculated for the grouped series as shown in the table. In the example below, the KMD plot shows that there are at least four series with different end groups. By using the KMR (Kendrick Mass Remainder) plot, it is possible to confirm that there are actually five series.


Elucidation of end-group structures from accurate mass measurement using high-resolution MALDI-TOFMS and MS/MS measurement (product ion mass spectrum)
msRepeatFinder can determine the elemental composition of the ions from the measured accurate mass. The result obtained for the elemental composition of the end group for group ④ is shown. The 4 candidates have the same elemental composition, but different degrees of polymerization. The information obtained from the product ion mass spectrum is utilized to narrow down the candidates. When a peak at m/z 23 is observed in the product ion mass spectrum, the precursor ion is recognized as being an Na adduct ion. The characteristic neutral loss indicates that the size of one end group is about 254 u while that of the other is relatively small. As a result, we could estimate that it was the polyethylene oxide which has an end group of C18H37/OH.


Analysis of copolymers by using a high resolution MALDI-TOFMS
It is important to use high mass-resolution to analyze copolymers, which consist of two or more species of monomer. An ultra-high mass resolution MALDI-TOFMS can separate many isobaric ion peaks (which have the same nominal mass but different accurate mass) on a mass spectrum. Since the mass spectra of copolymers are complicated, it is not practical to assign the peaks one by one. KMD analysis using msRepeatFinder makes it possible to visualize the distribution of polymer species. Below is the analysis example of an EO-PO block copolymer. The enlarged mass spectrum shows that peaks that are less than 0.03 u apart are clearly separated by a high mass-resolution. Visualizing the mass spectrum using a KMD plot (base unit: PO), a lattice is seen reflecting the PO distribution on the horizontal axis and the EO distribution in a diagonal direction.
In addition, Fraction Base KMD plots provide a clearer visualization of the polymer series than conventional KMD plots.

From the pattern on the KMD plot, it is possible to know the ratio of the two monomers contained in the binary copolymer, or the difference in the synthetic process of the copolymers. Below are the mass spectra and KMD plots (base unit: PO) of two EO-PO copolymers with approximately equal average molecular weights. A small amount of PO homopolymer was detected on the mass spectrum and the KMD plot of the PO-EO-PO block copolymer. This is considered to be one of the proofs that this sample is a block copolymer, as the residual EO or PO homopolymers in the randomly polymerized EO-PO copolymers are unlikely given the process of synthesizing the copolymers.
On the other hand, for the EO-PO random copolymer, the KMD plot shows that the numeric distribution of EO monomers is wide. In addition, by specifying the end groups, the DP (degree of polymerization) plot can be generated, and the molar ratio and weight ratio of EO and PO can be calculated. The weight ratio of the PO-EO-PO block copolymers are in good agreement with the published values. It is possible to estimate the EO/PO composition ratios of the EO/PO random copolymer whose EO/PO ratio is not disclosed.


Gel permeation chromatography (GPC) combined with high mass-accuracy MALDI-TOFMS
To analyze highly polydisperse polymers, it is effective to combine GPC with high mass-accuracy MALDI-TOFMS. This process displays the mass spectra of multiple fractions on Remainder of Kendrick Mass (RKM) plots for visual presentation of compositional distributions.

Note: This data was acquired in collaboration with the National Institute of Advanced Industrial Science and Technology.
Differential analysis of 2 polymer samples
The differential analysis of the end groups and molecular weight distributions of polymer samples is very important for checking the degradation of a sample, the difference between production lots, and the difference in the synthesis processes. msRepeatFinder (optional) can perform the differential analysis of two samples. Below is an application example used for the degradation analysis of polyethylene terephthalate. The bottom left shows the mass spectrum before and after degradation. Before degradation, cyclic oligomers, and after the degradation, the series having the COOH/COOH end groups were observed as major components respectively. In performing differential analysis, each sample was measured three times. The bottom right is the result of the differential analysis shown in the KMD plots. The red shows stronger peaks before degradation, while the green shows the stronger peaks after the degradation. In addition, a volcano plot can be created to confirm the components that differ with statistical significance between the 2 samples.


Polymer Analysis by Field Desorption (FD) and Kendrick Mass Defect (KMD) Analysis
msRepeatFinder can be applied not only to mass spectra measured by ultra-high mass-resolution MALDI-TOFMS, but also to high resolution mass spectra measured with other suitable soft ionization methods. The following is an example of application to the FD analysis data of a mixture of polystyrene (PS) and polypropylene oxide (PPO) acquired by using a high resolution GC-TOFMS, JMS-T2000GC AccuTOF™ GC-Alpha equipped with an EI/FI/FD combination ion source.

Analysis of Crude Oil with FD and KMD Analysis / Group-Type Analysis
msRepeatFinder is also applicable to KMD and group-type analyses of hydrocarbons. Below are the FD mass spectrum and the KMD plot of crude oil measured using the JMS-T2000GC AccuTOF™ GC-Alpha, a high-resolution GC-TOFMS equipped with an EI/FI/FD combination ion source. By visualizing the series of hydrocarbons with different degrees of unsaturation, each series can be easily grouped, and the following indicators are automatically calculated for each series.
- Sum of intensities
- Number average molecular weight
- Weight average molecular weight
After visualizing the mass spectrum on the KMD plot, a detailed group-type analysis can be performed.


Functions
- Import peak lists (up to 10 lists at a time)
- Display centroided (bar-graph) mass spectrum
- KMD plot
- Fraction base KMD plots
- KMR plots
- Remainder of KM (RKM) plot
- Estimated circles of homopolymer end groups (on KMR plots)
- Search polymer series
- Search homopolymer series and calculate average molecular weight (mass / degree of polymerization) and polydispersity (mass / degree of polymerization)
- Search binary copolymer, generate DP (degree of polymerization) plot, and calculate molar/weight ratio of 2 monomers.
- Grouping
- Color coded groups
- Enable/disable display of polymer series groups
- Calculating the average molecular weight/polydispersity of groups
- Relative ion intensity of each group with respect to the sum of the ion intensities of all groups
- Determination of elemental composition
- Elemental composition determination of monomers and end groups
- Saving history of elemental composition determination
- Differential analysis between two samples
- Noise filtering by means of machine learning (for data acquired with JMS-S3000)
Download a PDF of this information here.